My work centers around three interconnected domains: traffic assignment and network modelling, port–hinterland systems, and freight and trucking logistics. Within these areas, I use operations research techniques and data-driven methods to study and improve multimodal freight and logistics networks. The sections below highlight projects that best reflect my research interests and the balance I aim to strike between methodological contributions and real-world empirical applications.
Beyond publications, I am a strong advocate of open source research and strive to release large-scale frameworks along with documentation for community use. This page also lists our publications, presentations, and open-source software, with links to code for replicating results where available. For an up-to-date list, you can download my curriculum vitae or contact me for data or code, which I would be happy to share.
Research areas
Traffic assignment
Traffic assignment problems (TAPs) predict how travelers choose routes under the congestion that traffic itself creates. My research aims to make these problems more robust to errors in input data and faster to solve. This matters because TAPs are often solved thousands of times inside larger problems such as network design, origin-destination estimation, and model calibration.
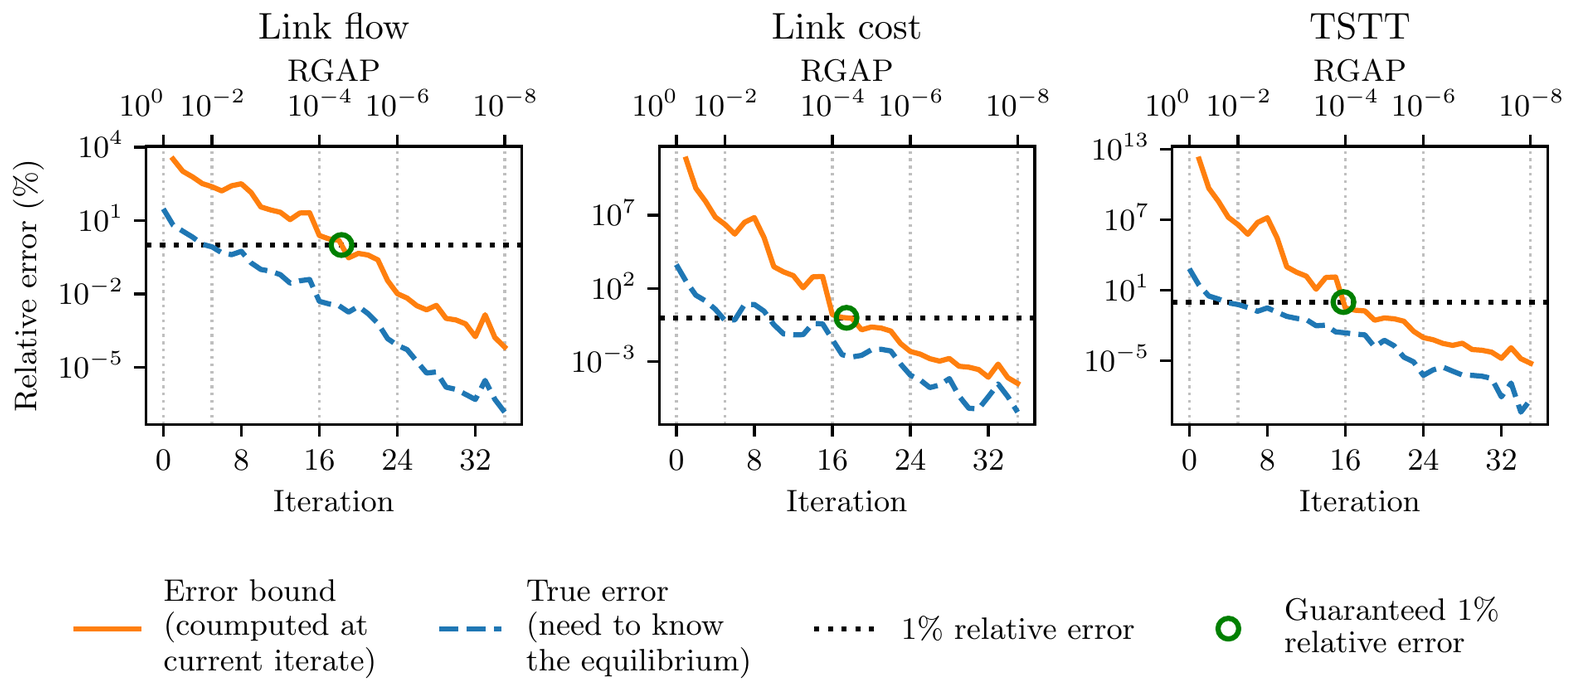
TAPs are nonlinear optimization problems, so they cannot be solved exactly in finite time; instead, iterative procedures move closer and closer to equilibrium. As it turns out, an extremely fundamental question in traffic assignment, when to stop these iterative procedures, was not understood theoretically. We often stop at a relative gap of 10−4, but that threshold comes from empirical studies, and such rule-of-thumb measures say nothing direct about the error in flows or travel times when a TAP is terminated early. For logit-based stochastic user equilibrium (SUE), we derived bounds on how far any solution can be from equilibrium in path flows, link flows, link costs, and total system travel time, using only quantities that each iteration already computes. In a network design application, these bounds let us discard poor designs after a few iterations instead of solving each one fully. This work began as a master’s thesis that received the CUTC Milton Pikarsky Memorial Award. [See the full preprint here]
Error bounds computed during the algorithm (orange) against the true error (blue, which requires knowing the equilibrium) for link flows, link costs, and total system travel time on the Chicago Sketch network.
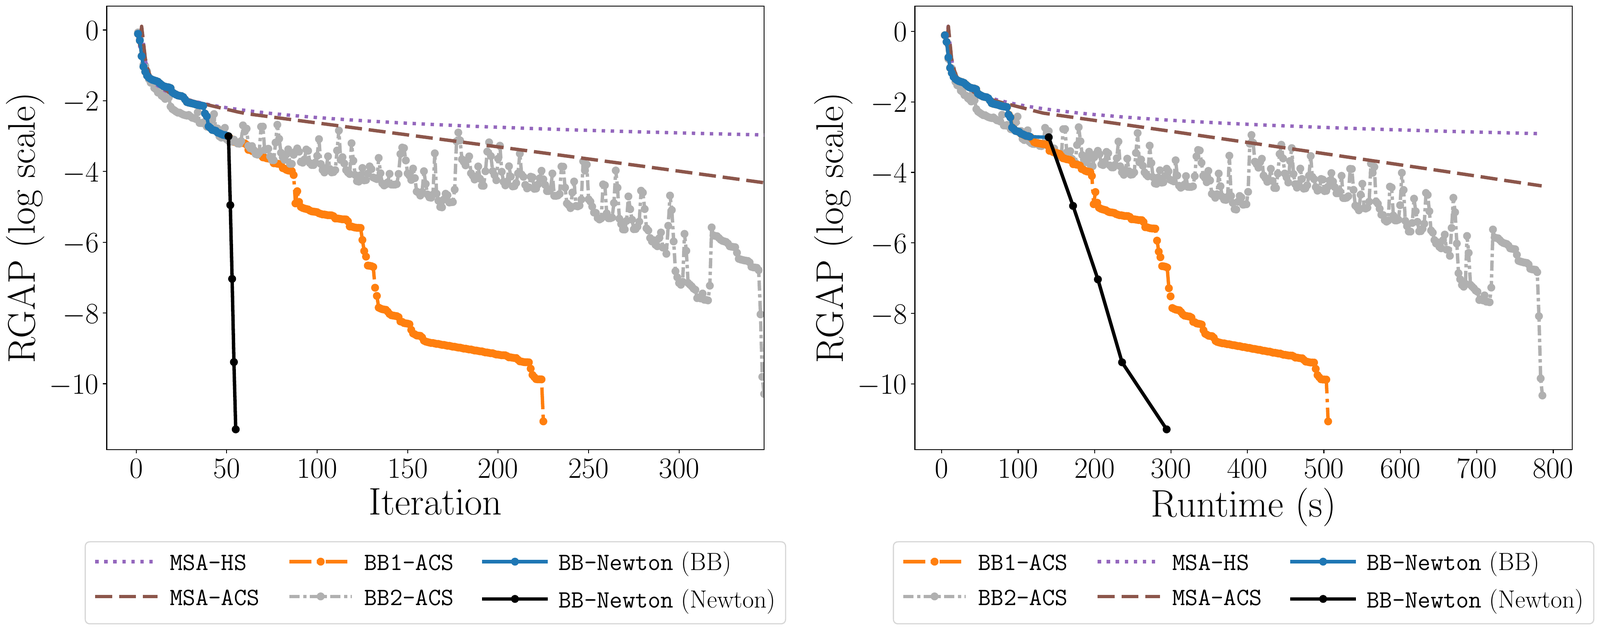
In another work, we studied the Jacobian of the logit mapping, the function that predicts users’ route choices for fixed route costs. It turns out that its eigenvalues are real and non-positive, which explains why the method of successive averages converges linearly when its step size is small enough, and we derived a bound on how small the step size must be to guarantee this. The same analysis led to a Newton method that converges quadratically near equilibrium. Our open-source solver, Logit-SUE, solves the Chicago Regional network (about 39,000 links and 2.3 million origin-destination pairs) to a relative gap of 10−10in about five minutes. [See a preprint of our work here][Try out the logit-SUE TAP solver!]
Convergence of SUE algorithms on the Chicago Regional network, by iteration (left) and runtime (right). Once Newton steps take over (black), the relative gap falls from about 10−3 to 10−10 in four iterations.
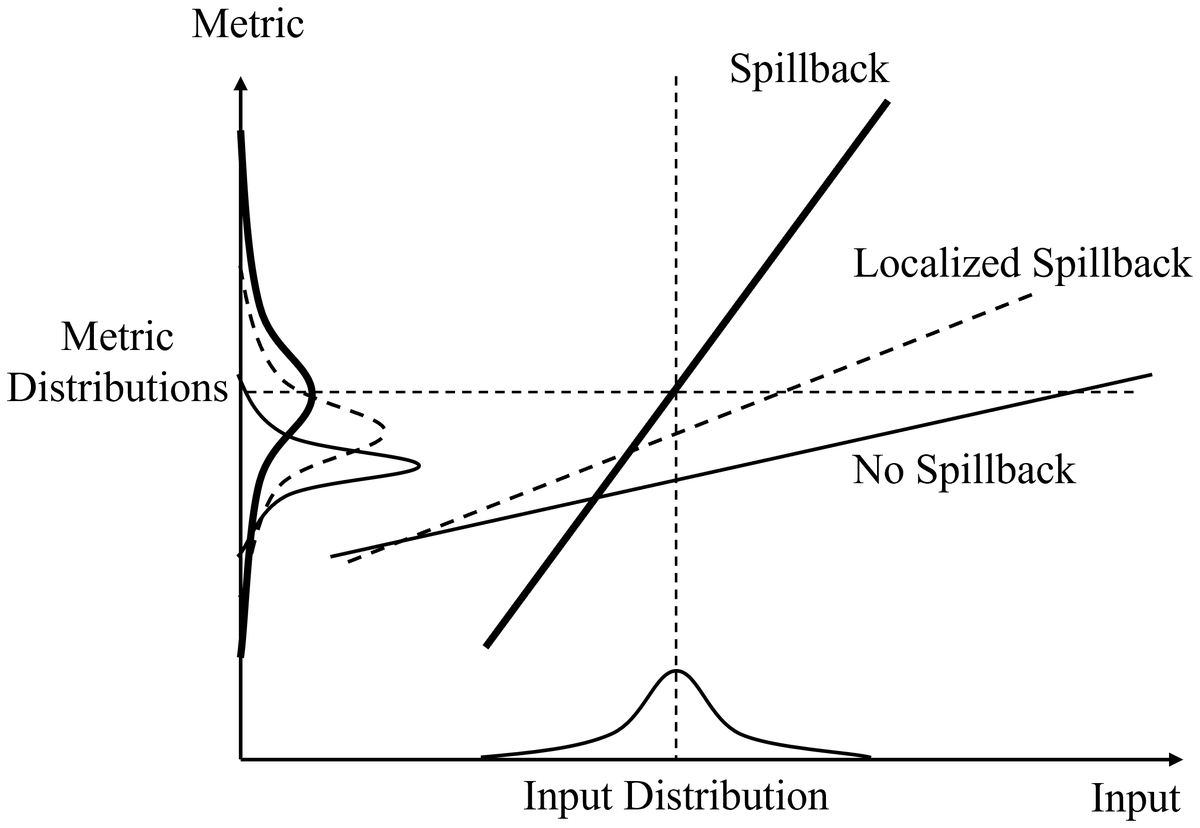
I have also worked on dynamic traffic assignment with uncertain demand. We showed that a more complex model that captures queue spillback, such as the cell transmission model (CTM), can perform worse than a simpler model, such as a point queue model, when the input data is erroneous. Queue spillback makes models more realistic, but it also makes them more sensitive to errors in demand forecasts, which can push predicted flows far from reality. We developed a method that models spillback only on links where it is likely to occur and identifies those links algorithmically across many demand scenarios. On the Austin network, this approach was more robust than full spillback when demand errors were large. [See a preprint of our work here]
Conceptual behavior of localized spillback (dashed) compared with no spillback and full spillback models as input demand varies.
Port and maritime logistics
We often look at road systems to model delays and routing behavior. However, a large chunk of the flow on roads often originates from other systems, such as maritime ports. When a port gets congested, the delays may not stay inside the port and can often spread to the roads and rail lines that serve it.
A port is a system of several interacting components: an anchorage where vessels wait, a navigation channel with several navigational restrictions, terminals where cargo is handled, and a landside interface of roadways, railways, and pipelines that moves cargo inland. Since many of these components behave like queueing systems, a bottleneck in one part of the system can have a disproportionate impact on many others. In a project with the U.S. Army Engineer Research and Development Center, we studied the Port of Houston, the largest U.S. port by waterborne tonnage, as one integrated system rather than as individual terminals.
Looking at vessel data from Houston, we noticed that right after a disruption, the port cleared vessels much faster for a while than it could sustain over the long run. This led us to separate operating capacity, the throughput a port can sustain over long periods, from ultimate capacity, the most it can process for a short time during a surge or after a disruption, and to develop system-level methods for estimating both. We estimated operating capacity with a parsimonious queueing model and ultimate capacity by fitting a differential equation model to simulation outputs. For Houston, we found that liquid-bulk terminals limited stable operations, while pilot availability became the binding constraint after disruptions. [See a preprint of our work here]
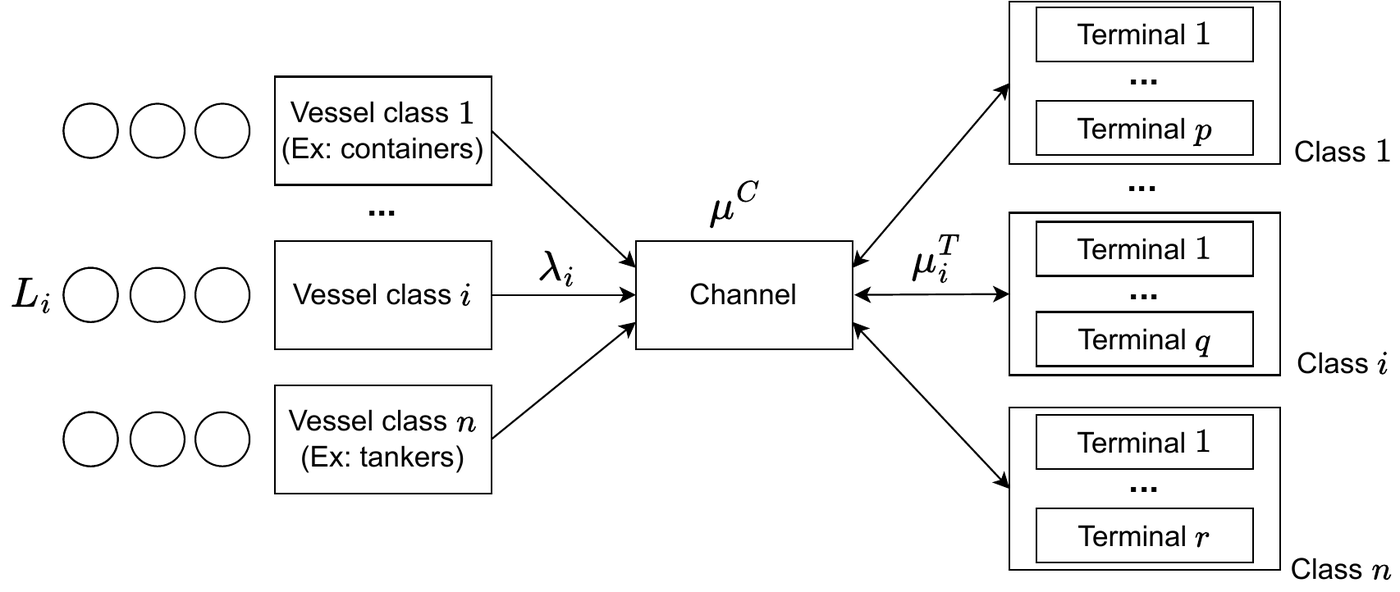
Structure of the port queueing model: vessels of each class wait in the anchorage, transit the shared channel, and are served at the terminals for their class.
To put these methods into practice, we developed MAPS (Multimodal Analysis Port Simulation), open-source software that lets planners test how new infrastructure would change capacity and resilience at a multimodal port. MAPS simulates a multi-terminal, multi-commodity port, and a channel scheduling algorithm links vessel transits to terminal operations. We used it to evaluate a hypothetical expansion of the Houston Ship Channel and found that the expansion added little long-term capacity but sped up recovery after a hurricane. This work received the Best Poster Award at the UT Austin Civil Engineering department’s Graduate Symposium and second prize in the Texas Institute of Transportation Engineers Student Paper competition. [See a preprint of our work here][Try out MAPS!]
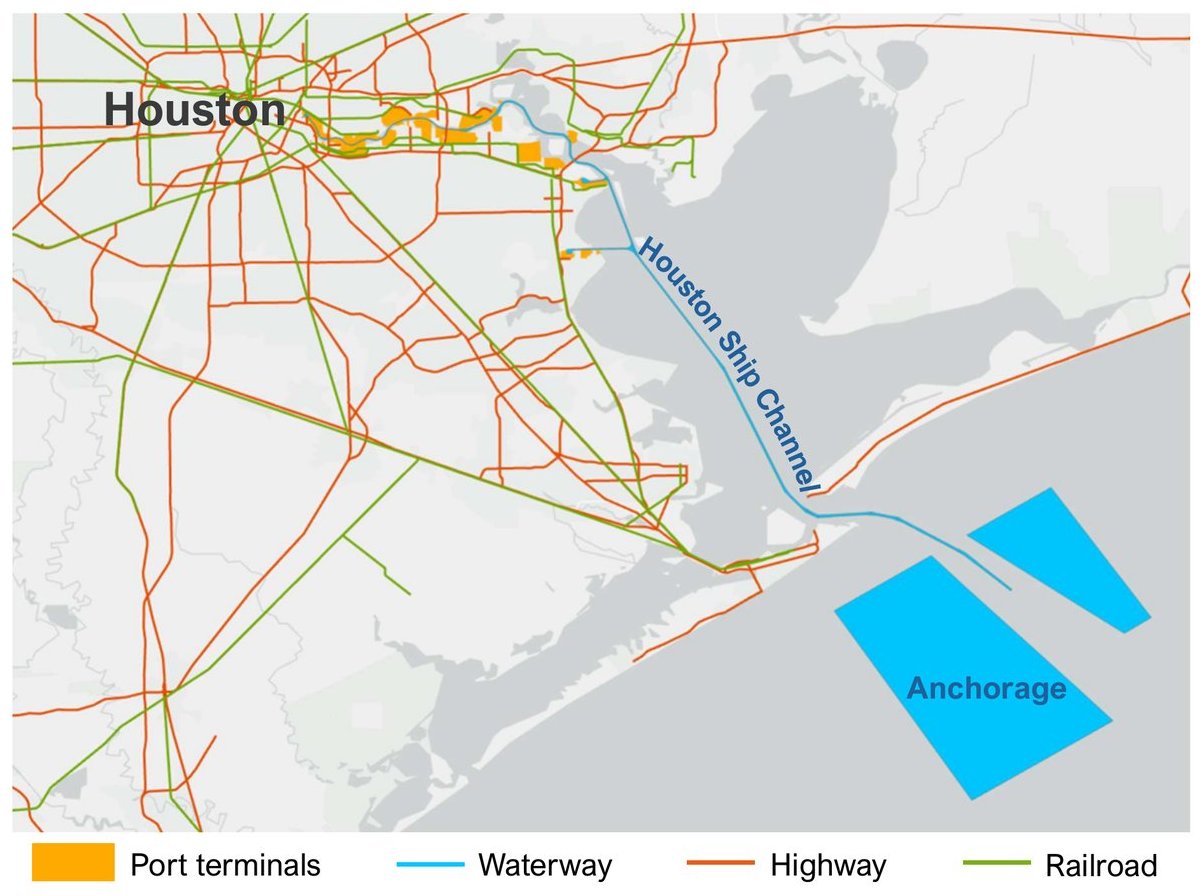
The Port of Houston system: terminals along the Houston Ship Channel, the offshore anchorage, and the highway and rail network that serves them. Basemap: Esri, TomTom, Garmin, FAO, NOAA, USGS, OpenStreetMap contributors.
Underneath these models is a lot of data. Using AIS vessel tracking data, we characterized how vessels arrive and queue at Houston over time, including the queues that build up when fog closes the channel. [Read the AIS data processing paper][Read the fog analysis paper]
We are now taking this work statewide through a project funded by the Texas Department of Transportation. Our team is building a multimodal freight model for Texas spanning waterways, railways, and roadways, along with a decision-support tool, built on stochastic traffic assignment, that predicts how freight moves across the state. The tool is meant to help evaluate infrastructure investments, prepare for disruptions, and compare future scenarios. More broadly, we are interested in resilience and re-routing during disruptions, data integration, and economic questions such as port pricing and demurrage.
Trucking logistics
I am also interested in routing and scheduling problems in freight logistics, especially extensions of classic vehicle routing problems with multiple objectives and constraints such as delivery time windows, in contexts like last-mile delivery and electric freight vehicles.
With e-commerce growing and delivery fleets going electric, the shortest delivery route is not necessarily the best one. Because an electric vehicle recovers energy through regenerative braking, the energy a route uses depends not just on its length but also on the slopes along it. Left turns across oncoming traffic also create conflicts at intersections that make a route less safe. In a project at the Indian Institute of Science, we looked at how to route last-mile electric delivery vehicles to use less energy while making fewer left turns, while still meeting customers’ delivery time windows.
Modeling turns was tricky, because whether a move is a left turn depends on three consecutive intersections rather than two. We handled this by building the model on the line graph of the road network, and formulated the problem as a bi-criterion Steiner traveling salesperson problem with time windows. We solved small instances exactly with mixed-integer programming and developed a local search heuristic for larger ones. We then tested the heuristic on 16 Amazon delivery routes in Austin, TX, each with 80 to 209 delivery stops, where our model performed considerably better than an adapted version of the well-known Lin-Kernighan-Helsgaun (LKH) heuristic. [The paper is published in Computers & Operations Research][See the code]
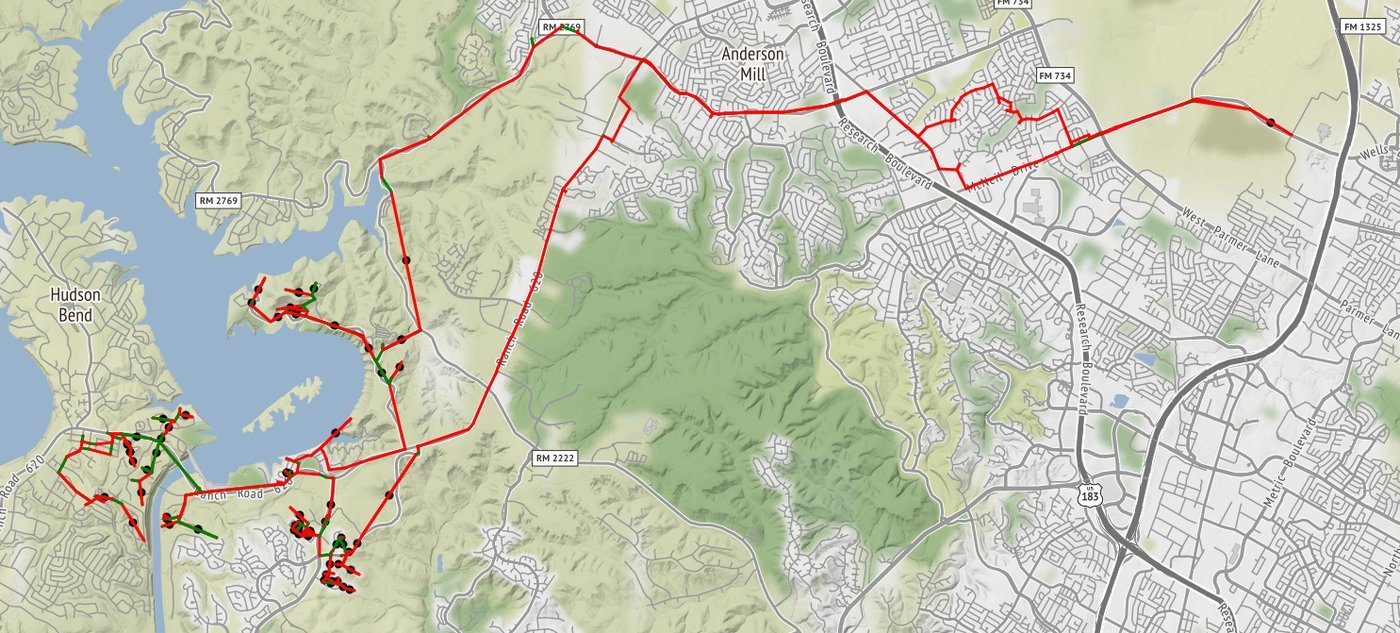
A delivery tour in Austin, TX that balances energy use and the number of left turns. Basemap: OpenStreetMap contributors.
Publications
Journal articles
Bathgate, K., Bagchi, D., Mitchell, K. N., Asborno, M. I., Kress, M. M., and Boyles, S. D. (2026). Anchorage Queue Dynamics due to Fog Channel Closures at the Port of Houston.
Journal of Waterway, Port, Coastal, and Ocean Engineering.
[Paper]
Bathgate, K., Bagchi, D., Mitchell, K. N., Asborno, M. I., Kress, M. M., and Boyles, S. D. (2026). Characterizing Longitudinal Vessel Arrival and Queue Behavior from AIS at the Port of Houston.
Journal of Waterway, Port, Coastal, and Ocean Engineering.
[Paper]
Agarwal, P.†, Bagchi, D.†, Rambha, T., and Pandey, V. (2025). A Bi-criterion Steiner Traveling Salesperson Problem with Time Windows for Last-Mile Electric Vehicle Logistics.
Computers & Operations Research.
[Paper][Code](† Equal contribution)
Under review and preprints
Bagchi, D. and Boyles, S. D. (2026). Error Bounds for Stochastic User Equilibrium Traffic Assignment.
Under review at Transportation Science.
[Paper][Code]
Bagchi, D.†, Bathgate, K.†, Mitchell, K. N., Asborno, M. I., Kress, M. M., and Boyles, S. D. (2026). A Simulation Framework for Evaluating Impacts of Expansion Projects on Multimodal Port System Capacity and Resilience.
Under review at Simulation Modelling Practice and Theory.
[Paper][Code](† Equal contribution)
Bagchi, D. and Boyles, S. D. (2026). Spectral Analysis of the Logit Mapping and Implications for Stochastic User Equilibrium Algorithms.
Under review at Transportation Research Part B.
[Paper][Code]
Robbennolt, J., Bagchi, D., and Boyles, S. D. (2026). Dynamic Traffic Assignment with Uncertain Demand: A Localized Queue Spillback Approach.
Under review at Transportmetrica B.
Bagchi, D., Bathgate, K., Mitchell, K. N., Asborno, M. I., Kress, M. M., and Boyles, S. D. (2025). Measuring Capacities in Multimodal Maritime Port Systems with Anchorage Queues.
Preprint.
[Paper]
Presentations
Peer-reviewed conference presentations
Bagchi, D. and Boyles, S. D. (2027). Spectral Analysis of the Logit Mapping and Implications for Stochastic User Equilibrium Algorithms. Transportation Research Board 106th Annual Meeting, Washington, DC.
Lectern session.
Bathgate, K., Bagchi, D., and Boyles, S. D. (2027). Resilience Metrics for Tropical Cyclone Anchorage Queue Responses. Transportation Research Board 106th Annual Meeting, Washington, DC.
Poster session.
Bagchi, D., Bathgate, K., Boyles, S. D., Mitchell, K. N., Asborno, M. I., and Kress, M. M. (2027). A Simulation Framework for Evaluating Impacts of Expansion Projects on Multimodal Port System Capacity and Resilience. Transportation Research Board 106th Annual Meeting, Washington, DC.
Poster session.
Bagchi, D., Bathgate, K., Boyles, S. D., and Asborno, M. I. (2026). A Dynamic Ultimate Capacity Framework for Seaport Systems. Transportation Research Board 105th Annual Meeting, Washington, DC.
Lectern session.
Bathgate, K., Bagchi, D., Boyles, S. D., Mitchell, K. N., Asborno, M. I., and Kress, M. M. (2026). Characterizing Anchorage Queue Dynamics due to Channel Fog Closures at the Port of Houston. Transportation Research Board 105th Annual Meeting, Washington, DC.
Poster session.
Robbennolt, J., Bagchi, D., and Boyles, S. D. (2026). Dynamic Traffic Assignment with Uncertain Demand: A Localized Queue Spillback Approach. Transportation Research Board 105th Annual Meeting, Washington, DC.
Poster session.
Robbennolt, J., Bagchi, D., and Boyles, S. D. (2025). Localized Queue Spillback with Uncertain Demand. 10th International Symposium on Dynamic Traffic Assignment (DTA 2025), Salerno, Italy.
Lectern session.
Bagchi, D. and Boyles, S. D. (2025). Error Bounds for Stochastic User Equilibrium Traffic Assignment. 12th Triennial Symposium on Transportation Analysis (TRISTAN XII), Okinawa, Japan.
Lectern session.
Bagchi, D., Bathgate, K., and Boyles, S. D. (2025). A Queuing-theory-based Operating Capacity Model for Multimodal Port Operations. Transportation Research Board 104th Annual Meeting, Washington, DC.
Lectern session.
Bathgate, K., Bagchi, D., and Boyles, S. D. (2025). Use of AIS Data to Characterize Vessel Mix in Houston Port Operations for Simulation. Transportation Research Board 104th Annual Meeting, Washington, DC.
Lectern session.
Bagchi, D., Agarwal, P., Rambha, T., and Pandey, V. (2023). A Local Search Heuristic for Bi-criterion Steiner Traveling Salesperson Problem. Transportation Research Board 102nd Annual Meeting, Washington, DC.
Poster session.
Invited presentations
Bagchi, D. and Boyles, S. D. (2026). Theoretical and Algorithmic Advances in Logit-Based Stochastic User Equilibrium Traffic Assignment. INFORMS Annual Meeting 2026, San Francisco.
Invited session.
Bagchi, D., Bathgate, K., and Boyles, S. D. (2025). A Framework for Measuring Maritime Port System Capacities with Limited Input Data. INFORMS Annual Meeting 2025, Atlanta.
Invited session.
Bathgate, K., Bagchi, D., and Boyles, S. D. (2024). Identifying Capacities in a Multimodal Maritime Freight Network. INFORMS Annual Meeting 2024, Seattle.
Invited session.
Bagchi, D. and Boyles, S. D. (2024). Error Bounds for Stochastic User Equilibrium Traffic Assignment. INFORMS Annual Meeting 2024, Seattle.
Invited session.
Technical presentations
Bathgate, K., Bagchi, D., and Boyles, S. D. (2025). Simulation Methods for Measuring Multimodal Maritime Freight System Capacity and Resilience: A Case Study at the Port of Houston. UT Austin Center for Transportation Research Annual Symposium, Austin.
Bathgate, K., Bagchi, D., and Boyles, S. D. (2024). Data-Driven Modeling for Multimodal Port Resilience Assessment. UT Austin Center for Transportation Research Annual Symposium, Austin.
Bagchi, D., Agarwal, P., Rambha, T., and Pandey, V. (2022). A Local Search Heuristic for Bi-criterion Steiner Traveling Salesperson Problem. INFORMS Annual Meeting 2022, Indianapolis.
Contributed session.
Open-source software
Logit-SUE(Developer) A fast open-source Python solver for path-based logit stochastic user equilibrium, with Newton-GMRES, Barzilai-Borwein, and adaptive step-size methods. Benchmarked on large networks, including Chicago Regional and Philadelphia.
[Code]
Multimodal Analysis Port Simulation (MAPS)(Lead developer) A modular Python discrete-event simulation of container, liquid bulk, and dry bulk terminals, covering waterway and landside operations (rail and roads). Supports capacity, bottleneck, and what-if analysis under channel expansion, hurricane, and fog scenarios.
[Code][Technical manual]
Last-Mile EV Logistics(Co-developer) Heuristic and exact (mixed-integer programming) methods for safe and energy-efficient routing of last-mile electric freight vehicles, with Amazon delivery data from Austin, TX.
[Code]